Understanding Our Air Quality Analysis
At PropertyInsights 101, we believe air quality is a vital — but often overlooked — component of property health. Our proprietary Air Quality Smell Interpreter system translates technical pollutant data into human-readable environmental profiles so buyers, homeowners, and investors can better understand potential environmental factors that impact livability, comfort, and long-term health.
Why Air Quality Matters for Property Decisions
Many traditional property reports neglect local air quality altogether. However, poor air quality can accelerate building material deterioration, impact human respiratory and cardiovascular health, lower long-term property values, and increase insurance risks or renovation costs.
By incorporating air quality into the Property Health Score, we offer a more complete picture of environmental risks associated with each property.
Example Air Quality Report
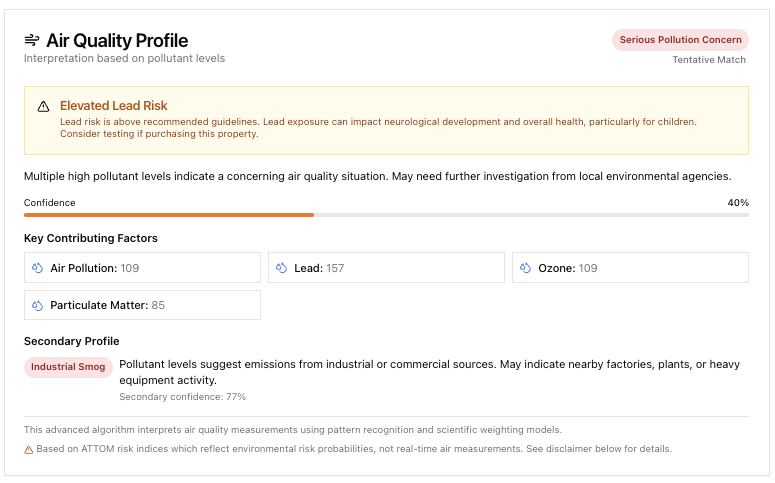
Here's how our comprehensive air quality data appears in an actual property report:
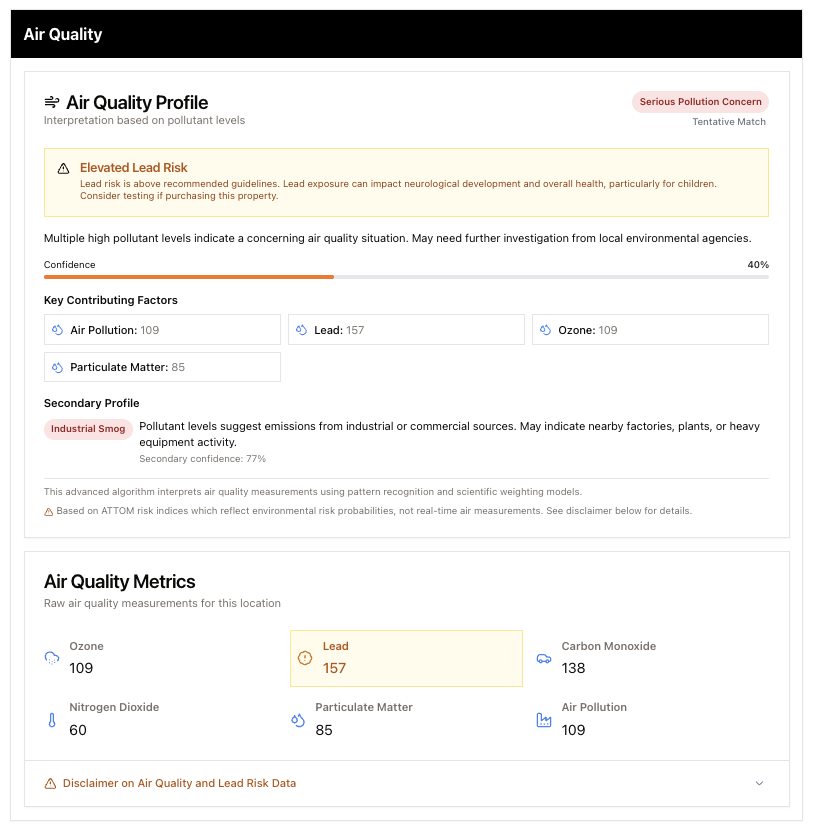
Our reports show a complete breakdown of air quality metrics, risk profiles, and interpretation.
How Our Air Quality Analysis Works
Our system collects environmental pollutant indices including:
- Ozone (O₃): A key component of smog, formed when pollutants from cars, power plants, and other sources react with sunlight.
- Lead (Pb): A heavy metal that can accumulate in the body, causing serious health effects including neurological damage.
- Carbon Monoxide (CO): An odorless, colorless gas that can be harmful when inhaled, often produced by vehicle exhaust.
- Nitrogen Dioxide (NO₂): A reddish-brown gas that can irritate the respiratory system and contribute to the formation of ozone.
- Particulate Matter (PM2.5 and PM10): Tiny particles in the air that can penetrate deep into the lungs and even enter the bloodstream.
- Aggregate Air Pollution Score: A comprehensive measurement combining various pollutants into a single air quality index.
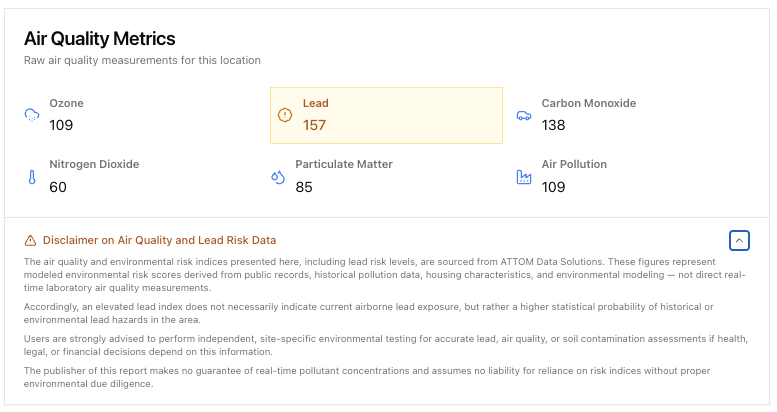
Example of raw air quality measurements collected for a property location
Using these measurements, we apply a proprietary Smell Interpreter algorithm that:
- Matches pollutant patterns against real-world environmental profiles (e.g., "Highway Exhaust," "Industrial Smog," "Campfire Smoke")
- Weights health-critical pollutants like Lead and Carbon Monoxide more heavily
- Calculates confidence scores based on data completeness and pollutant exceedance severity
- Applies dynamic threshold adjustments when limited data is available, ensuring more robust interpretations
Important Disclaimer
Our air quality profiles are based on available environmental data models. Lead levels, for example, are modeled as environmental risk indices rather than real-time lab-measured airborne concentrations. Users are strongly encouraged to pursue independent site-specific testing if air quality poses a material concern to the property decision.
Environmental Profiles We Detect
Our Air Quality Smell Interpreter can identify environmental conditions such as:
Campfire Smoke
Possible proximity to outdoor fire activity or fireplace use.
Highway Exhaust
Indicators of nearby heavy traffic zones.
Industrial Smog
Signs of industrial or commercial emissions.
Tilled Earth
Dust and particulate exposure from farmland or dry soil.
Photochemical Haze
Ozone-heavy conditions typical of warm, stagnant climates.
Urban or Suburban Blend
Air signatures consistent with residential and commercial mixed environments.
Crisp Fresh Air
Low pollutant signatures indicative of clean, healthy surroundings.
Serious Pollution Concern
High pollutant levels warranting immediate attention.
Each profile helps contextualize the air quality into terms buyers can easily understand — like "what the air would likely smell and feel like living there."
How Air Quality Contributes to the Property Health Score
Air quality accounts for 10% of the overall Property Health Score calculation. Higher air quality risk — such as proximity to highways, industrial facilities, or historical contamination — can reduce a property's health score, signaling increased environmental exposure risks. Conversely, properties located in areas with consistently low pollutant levels receive health score boosts.
Potential Applications
Here are some hypothetical scenarios illustrating how air quality data might be used in property decisions:
Scenario: Rural Property Considerations
Air Quality Profile Example: "Tilled Earth"
Situation: When evaluating rural properties near agricultural areas, homebuyers might consider potential seasonal air quality variations.
Consideration: Air quality data showing particulate matter patterns consistent with agricultural activities could be relevant for families with respiratory sensitivities.
Possible Action: Homebuyers might consider additional air filtration systems as part of their home improvement planning.
Scenario: Urban Property Assessment
Air Quality Profile Example: "Highway Exhaust"
Situation: Urban properties may have complex air quality profiles that aren't immediately obvious from visual inspection.
Consideration: Air quality data showing traffic-related pollution patterns might be one of many factors considered in property evaluation.
Possible Action: This information could potentially inform negotiations or improvement planning, depending on individual priorities.
Educational Disclaimer
These scenarios are provided for educational purposes only and do not represent actual case studies or guaranteed outcomes. Every property decision involves numerous factors, and air quality is just one consideration among many. Results will vary based on individual circumstances.
Why This Information Matters
Understanding environmental factors like air quality can be one component of informed real estate decision-making. PropertyInsights 101 aims to provide data that may help buyers, sellers, and property owners consider multiple aspects of property health.
Our Mathematical Model
Air Quality Interpretation System
Our Air Quality analysis works as a two-layer mathematical system:
Layer 1: Air Quality Interpretation Submodel
First, we take raw pollutant measurements and apply dynamic threshold relaxation when needed:
Then we process these pollutant values through our Smell Interpreter function, which uses a sophisticated weighted exceedance calculation:
Where:
- S = Final smell profile score
- M = Set of matching pollutants
- wi = Pollutant weight based on health impact
- vi = Observed pollutant value
- ti = Pollutant threshold (using Teffective)
- p = Profile priority boost for severe pollutants
- d = Number of available data points
- T = Total required data points
- ln(1+x) = Natural logarithm scaling for smooth response
Layer 2: Property Health Score Master Formula
The resulting Air Quality Score becomes one component in our overall Property Health Score:
Where Air Quality represents 10% of the total property health assessment weight.
Visualization of the Two-Layer System

Mathematical flow of our air quality analysis and score integration
Continuous Improvement
As better pollutant models, localized monitoring data, and environmental research emerge, PropertyInsights 101 is committed to continuously refining our Air Quality Interpreter to maintain cutting-edge environmental analysis standards.
- We regularly update our monitoring data connections to capture the latest EPA measurements
- Our pattern-matching algorithms are periodically recalibrated based on validation against actual site testing
- We incorporate new research on health impacts of various pollutants as it becomes available
- Feedback from environmental experts and property professionals helps us fine-tune our interpretation thresholds
Looking to the Future
We're constantly expanding our air quality analysis capabilities. Future enhancements will include more granular neighborhood-level data, improved seasonal pattern detection, and additional environmental profile categories to provide even more precise insights for property buyers and owners.