Understanding Our Approach
PropertyInsights 101 has developed a proprietary risk assessment model that evaluates properties across 9 critical factors to generate comprehensive risk scores. Our model is designed to provide objective, data-driven insights that help real estate investors, homebuyers, and property owners make informed decisions.
Unlike simplistic models that focus on just a few variables, our approach incorporates multiple dimensions of risk to create a holistic property health score. Each factor is carefully weighted based on statistical validation and real-world impact studies.
Why Our Model Matters
Traditional property assessments often miss critical risk factors that can significantly impact property value and livability. Our model provides a standardized way to compare properties and identify potential issues before they become costly problems.
The 8 Critical Risk Factors
Our risk assessment model evaluates properties across the following key dimensions, each contributing to the overall property health score:
- Property Condition (23% weight): Analyzes multiple factors related to the physical condition, including maintenance records, inspection reports, and visible issues. Includes a modifier for owner-occupancy status (+5 points for owner-occupied properties, -10 points for absentee owners).
- Crime Risk (15% weight): Evaluates current crime statistics and trends in the property's location using data from local law enforcement and national crime databases, with personal crimes weighted at 70% and property crimes at 30%.
- Tax Assessment Recency (13% weight): Evaluates how recently the property has been assessed for tax purposes, which impacts the accuracy of valuation and protects against unexpected tax bills.
- Property Age & Renovation Status (10% weight): Considers the age of major building components, with renovations factored in as age modifiers. Recent substantial renovations can significantly improve the effective age score.
- Natural Disaster Risk (8% weight): Assesses vulnerability to floods, earthquakes, wildfires, hurricanes, tornadoes, and other natural hazards. Integrates FEMA flood zone designations, LOMA (Letter of Map Amendment) approvals, and property elevation data relative to Base Flood Elevation (BFE).
- Transportation Noise (8% weight): Uses scientifically accurate acoustic modeling to assess noise impact from transportation sources including road, rail, aviation, and emergency services.
- Cost of Living (10% weight): Evaluates local affordability using a proprietary Weighted Impact Score (WIS) methodology that factors in housing, food, transportation, healthcare, utility costs and more, adjusted for local income levels.
- Air Quality (7% weight): Measures local air quality using EPA data and proximity to pollution sources like highways, industrial facilities, or waste sites.
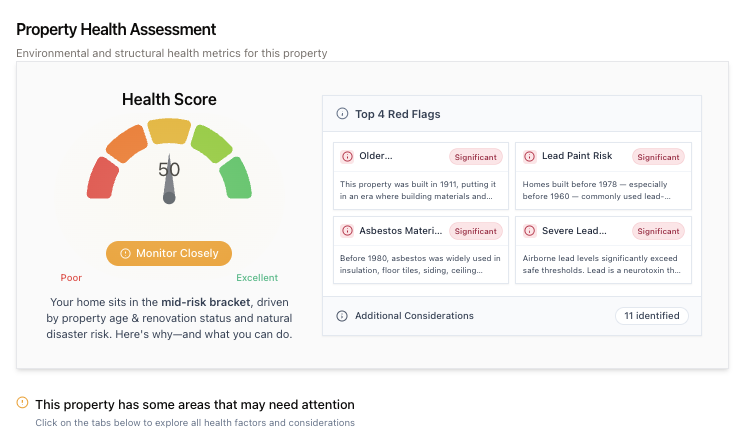
Real-World Example
Want to make smarter property decisions? At PropertyInsights101, we break down exactly what impacts a home's health — here's a real example from one of our reports:
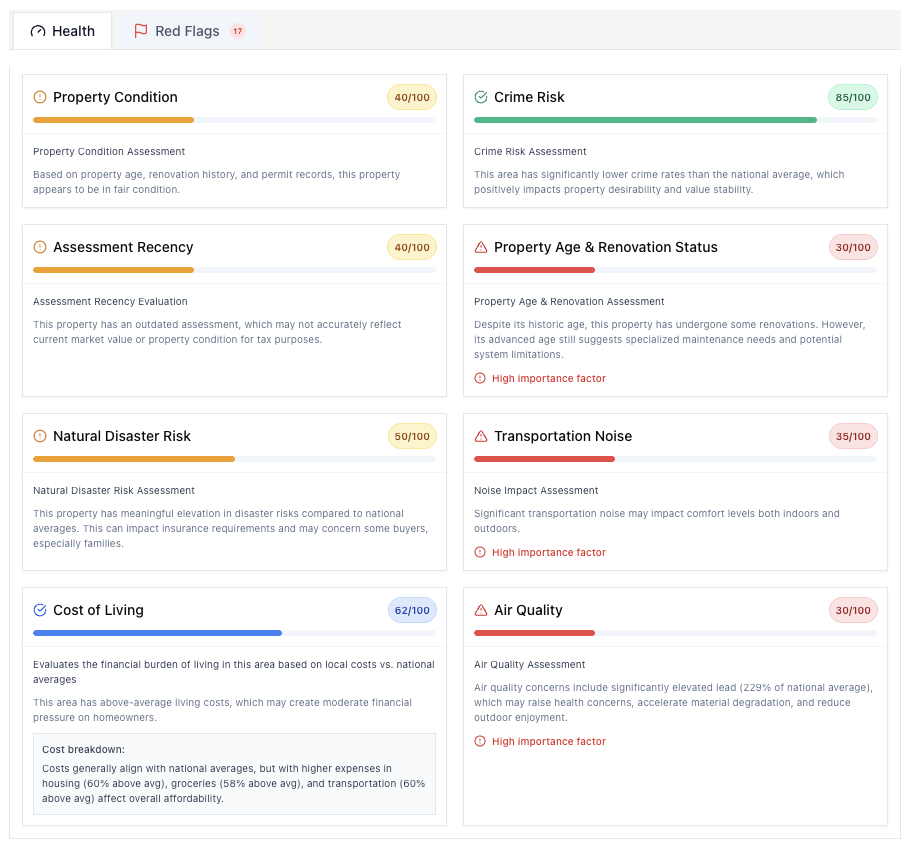
Our easy-to-read health factor charts show you how each risk element affects a property's overall score — so you can spot hidden issues before they become costly problems.
Risk Score Calculation Formula
Our property risk score is calculated using a weighted normalized sum formula that combines all eight factors:
$W_i$ = Weight of factor i (expressed as a percentage)
$S_i$ = Score of factor i (normalized to a 0-100 scale)
$\sum$ represents the sum across all factors
Step-by-Step Calculation Process
- Each risk factor is evaluated using relevant data sources and assigned a raw score.
- Raw scores are normalized to a consistent 0-100 scale (where 100 represents the lowest risk).
- Each normalized score is multiplied by its respective weight.
- The weighted scores are summed and divided by the total weight (100%).
- The final score is presented on a scale of 0-100, with higher scores indicating healthier properties with lower risk.
Important Note on Scoring
Our risk scores should be interpreted as relative measures rather than absolute values. A property with a score of 85 has lower risk than one with a score of 75, but the specific interpretation may vary based on location, property type, and intended use.
Transportation Noise (8%)
Our Transportation Noise assessment uses advanced acoustic science principles to accurately evaluate the noise impact on a property's living environment.
Acoustic Science Methodology
Scientifically-Based Calculation
Unlike simplified scoring systems, our approach is based on established acoustic engineering principles:
- Real-World Conversions: We convert abstract noise levels (0-4) to actual decibel values (40-80 dB) aligned with environmental noise classifications
- Physics-Based Adjustments: Each noise source receives precise adjustments based on:
- Distance (using the inverse square law for sound propagation)
- Frequency characteristics (low-frequency rail noise receives higher weighting)
- Psychoacoustic impact (unexpected sounds like train whistles receive appropriate penalties)
- Logarithmic Sound Combination: We use scientifically correct logarithmic addition rather than simple averaging, as sound energy combines logarithmically in the real world
Advanced Duration-Weighted Calculation
Our algorithm uses time-weighted equivalent continuous sound level (Leq) calculations that factor in how often each noise source is present:
$L_i$ = Adjusted sound level (dB) for source i
$d_i$ = Duration factor for source i
Duration factors: Road (100%), Rail (25%), Aviation (30%), Rail Whistles (10%), Emergency (5%)
Health Impact Assessment Based on WHO & EPA Guidelines
The final combined decibel value is translated to a health impact score following established guidelines:
- ≤40 dB: 100 points (Optimal)
- ≤45 dB: 95 points (Excellent - WHO's "no observed effect level")
- ≤50 dB: 85 points (Very Good)
- ≤55 dB: 75 points (Good - WHO outdoor daytime threshold)
- ≤60 dB: 65 points (Moderate)
- ≤65 dB: 50 points (EPA/WHO threshold for significant annoyance)
- ≤70 dB: 35 points (WHO threshold for health risk)
- ≤75 dB: 20 points (High Impact)
- >75 dB: 10 points (Severe Impact)
Source-Specific Factors
Road Noise
Evaluates proximity to various road types with specific adjustments:
- Distance-based adjustments following inverse square law
- Higher penalties for major highways vs. local roads
- Proximity penalties: +5 dB for <0.1km, +3 dB for <0.3km
- Accounts for peak traffic variations
Rail Noise
Considers low-frequency characteristics and nighttime propagation:
- Base +3 dB adjustment for unique low-frequency profile
- Proximity adjustments: +4 dB for <0.25km (includes vibration), +2 dB for <0.5km
- Accounts for nighttime sound propagation
Train Whistle Impact
Incorporates federal guidelines for horn noise at crossings:
- Base +5 dB adjustment for psychoacoustic impact (tonal qualities)
- Distance-based penalties: +7 dB (<0.25km), +5 dB (<0.5km), +3 dB (<1.0km)
- Distance reduction: -2 dB for distances >2.0km
Aviation Noise
Assesses flight path impacts beyond just airport proximity:
- +3 dB base adjustment for aviation's psychological impact
- Flight path adjustments: +6 dB for <3km, +3 dB for <8km
- Distance reduction: -2 dB for distances >20km
Natural Disaster Risk (8%)
Our Natural Disaster Risk assessment combines multiple risk factors with sophisticated weighting for a comprehensive evaluation.
Flood Risk (40% of Disaster Score)
FEMA Flood Zone Classification
Properties receive different base scores based on their official FEMA flood zone:
- Zone X, C, or D (Minimal to Moderate Risk): 80/100 points
- Zone B (Moderate Risk): 70/100 points
- Zone A or V (High Risk): 40/100 points base score
Base Flood Elevation (BFE) Assessment
For properties in high-risk flood zones, elevation is your hidden advantage. Our proprietary algorithm recognizes when your property stands higher than FEMA's Base Flood Elevation:
- Smart Elevation Recognition: When your property sits above the flood plain, we boost your score to reflect this natural protection
- Progressive Improvement: Each foot of elevation above the flood plain significantly improves your score (up to 20 additional points)
- Real-World Protection Factors: This elevation advantage can mean reduced flood insurance costs and better long-term property protection
LOMA Status Recognition
Our advanced algorithm identifies properties with FEMA's official seal of reduced flood risk - Letters of Map Amendment (LOMA):
- Official Risk Reduction: LOMA documents represent FEMA's expert acknowledgment that your property deserves a better flood risk classification
- Premium Score Enhancement: Properties with approved LOMA records receive a significant 15-point boost to their flood risk score (up to a maximum of 90)
- Financial Benefits: This recognition typically translates to reduced or eliminated flood insurance requirements, potentially saving thousands over the life of ownership
Exclusive Risk Rating 2.0 Advantage
Our cutting-edge algorithm is fully aligned with FEMA's latest Risk Rating 2.0 system (launched 2021). Unlike outdated risk models that rely solely on flood zone maps, our system recognizes individual property characteristics—elevation, construction, and flood barriers—to deliver the most precise risk assessment possible. This advanced integration provides you with the most current, accurate risk information available anywhere.
Additional Natural Disaster Factors
Earthquake Risk (15%)
Based on ATTOM's earthquake_Index where 100 represents the national average:
- 0-100: Low Risk (80-100 points)
- 101-120: Moderate Risk (60-80 points)
- 121-150: High Risk (40-60 points)
- 151-180: Severe Risk (20-40 points)
- >180: Critical Risk (0-20 points)
Hurricane Risk (15%)
Based on ATTOM's hurricane_Index where 100 represents the national average:
- 0-100: Low Risk (80-100 points)
- 101-120: Moderate Risk (60-80 points)
- 121-150: High Risk (40-60 points)
- 151-180: Severe Risk (20-40 points)
- >180: Critical Risk (0-20 points)
Tornado Risk (15%)
Based on ATTOM's tornado_Index where 100 represents the national average:
- 0-100: Low Risk (80-100 points)
- 101-120: Moderate Risk (60-80 points)
- 121-150: High Risk (40-60 points)
- 151-180: Severe Risk (20-40 points)
- >180: Critical Risk (0-20 points)
Wildfire Risk (15%)
Using wind_Index as a proxy where 100 represents the national average:
- 0-100: Low Risk (80-100 points)
- 101-120: Moderate Risk (60-80 points)
- 121-150: High Risk (40-60 points)
- 151-180: Severe Risk (20-40 points)
- >180: Critical Risk (0-20 points)
Confidence Calculation
Our confidence in the natural disaster risk assessment increases with each risk factor we can evaluate:
- Base confidence: 50%
- Each evaluated risk factor adds 10% to confidence
- Maximum confidence: 90%
Crime Risk (16%)
Our Crime Risk assessment evaluates both overall crime levels and specific crime types to provide a nuanced view of safety risks.
Total Crime Index (40% of Crime Score)
Based on the ATTOM crime_Index where 100 represents the national average:
- 0-50: Very Low Risk (90-100 points)
- 51-80: Low Risk (75-89 points)
- 81-100: Average Risk (60-74 points)
- 101-150: Elevated Risk (40-59 points)
- 151-200: High Risk (20-39 points)
- >200: Very High Risk (0-19 points)
Specific Crime Type Analysis (60% of Crime Score)
We analyze specific crime types when data is available, giving higher weight to violent crimes:
Violent Crime (35%)
Includes assault, robbery, and other person-targeted crimes. Scored using the same scale as total crime but with heavier weighting for resident safety.
Property Crime (25%)
Includes burglary, theft, and vandalism. Directly impacts property value and insurance rates.
Important Note on Crime Data
Crime statistics are influenced by reporting practices, jurisdiction differences, and demographic factors. Our risk assessment represents general probabilities rather than guarantees of safety or risk.
Cost of Living (11%)
Our Cost of Living assessment employs a sophisticated Weighted Impact Score (WIS) v1 methodology to provide a nuanced evaluation of financial affordability across multiple dimensions.
Weighted Impact Score Methodology
Mathematical Formula
Our Weighted Impact Score (WIS) calculation uses the following precise mathematical formula:
$D$ = deviation %, $W$ = spending weight, $V$ = variance factor, $A$ = income adjustment, $E$ = elasticity factor
Key Components
- Spending Weight (W): % of typical household budget
- Local Income Adjustment (A): Cost vs. earning power
- Elasticity Factor (E): Spending flexibility
- Variance Impact (V): Higher = 1.2×, Lower = 0.8×
- Work-from-Home Adjustment: For transportation
Economic Principles
- Cost indices normalized against national average (100)
- Budget weights from Bureau of Labor Statistics data
- Elasticity factors recognize spending flexibility differences
- Prospect theory applies asymmetric impact (1.2× for higher costs)
- Local income adjustment provides geographical context
- Transportation costs adjusted for work-from-home trends
- Dollar impact calculated relative to monthly spending
National Average-Based Scoring
Our scoring system uses the national average (index of 100) as a baseline:
- National Average (Index = 100): Base score of 75 points
- Below Average Costs: Score increases proportionally (boost for affordability)
- Above Average Costs: Score decreases proportionally (penalty for high costs)
Data Sourcing and Granularity
Zip Code Level Analysis
Our cost data analysis focuses on accurate zip code level insights:
- Detailed cost assessment at the zip code level
- Neighborhood-specific cost of living metrics
- Localized affordability indicators
- Direct comparison to national averages for context
Elasticity Adjustments
Our model accounts for demand elasticity differences:
- Housing costs weighed more heavily due to inelastic demand
- Transportation costs adjusted for remote work potential
- Food costs categorized by necessity vs. discretionary
- Healthcare evaluated based on unavoidable core expenses
Financial Decision-Making Impact
Our Cost of Living score is designed to help first-time homebuyers understand the true financial implications of a property purchase, accounting for both the direct property expenses and the broader economic landscape of the area. This provides a robust foundation for long-term financial planning beyond the initial purchase price.
Air Quality (7%)
Our Air Quality assessment evaluates multiple pollutants and their health impacts using ATTOM environmental data.
Pollutant Index Analysis
All ATTOM pollutant indices are calibrated where 100 represents the national average, with higher values indicating higher pollution levels:
Lead Index (25%)
Lead pollution is heavily weighted due to its severe neurological health impacts, especially for children and pregnant women.
- Critical Risk (>175): 0-20 points
- High Risk (126-175): 21-40 points
- Moderate Risk (101-125): 41-60 points
- Low Risk (<=100): 61-100 points
Special consideration: Lead levels above 175 trigger emergency warnings due to severe health risks.
Air Pollution Index (20%)
Overall air pollution composite score that captures general air quality concerns.
Carbon Monoxide (15%)
Associated with heart disease and respiratory issues, with significant health impacts.
Particulate Matter (15%)
Fine particles that can penetrate deep into lungs and bloodstream, causing respiratory problems.
Ozone (15%)
Ground-level ozone can trigger asthma attacks and cause respiratory inflammation.
Nitrogen Dioxide (10%)
Associated with respiratory problems and reduced lung function, especially in children.
Air Quality Pattern Recognition Exclusive Feature
What makes our approach unique: While standard air quality reports simply present individual pollutant levels, our proprietary Multi-Dimensional Pollutant Matrix System™ analyzes complex interactions and relationships between multiple pollutants simultaneously. Our sophisticated correlation matrix system uses weighted thresholds and pattern-matching algorithms to identify specific environmental signatures that traditional single-dimension assessments completely miss.
Our proprietary matrix-based pattern recognition system goes beyond basic air quality indexes by examining how various pollutants interact with each other, creating distinctive environmental fingerprints that can indicate specific sources:
Matrix-Based Pattern Matching
Our system uses a sophisticated matrix of pollutant thresholds to identify specific environmental signatures such as "Industrial Smog," "Urban Environment," "Campfire Smoke," and "Photochemical Haze." By analyzing precise pollutant combinations and their relative concentrations, we can detect patterns invisible to standard monitoring systems that only measure individual pollutant levels.
Dynamic Threshold Analysis
Unlike binary "good/bad" air quality systems, our proprietary algorithm applies logarithmic scaling, weighted pollutant coefficients, and adaptive threshold relaxation to accurately identify pollution patterns even when data is incomplete. The system calculates a nuanced confidence score that reflects match strength and data completeness for superior reliability.
Health Impact Analysis
Each identified air quality pattern has specific health implications based on our comprehensive pollution profile database. For example, "Photochemical Haze" affects respiratory systems differently than "Industrial Smog," even at similar overall pollution levels. Our system provides contextually relevant health insights for each recognized pattern rather than generic advice.
Real-World Example: "Campfire Smoke" Pattern Detection
Standard air quality monitors might report elevated particulate matter but miss the critical context. Our proprietary matrix system can identify when specific combinations and ratios of particulate matter and carbon monoxide exceed their correlation thresholds simultaneously - a signature pattern that indicates nearby wood burning activity. This pattern detection provides homeowners with actionable context about environmental conditions that simpler air quality indices miss entirely.
Property Age & Renovation Status (12%)
Our Property Age assessment considers both chronological age and effective age (accounting for renovations and updates).
Age Calculation Methodology
Base Age Score
The base score uses a sliding scale based on construction year:
| Property Age Category | Years | Point Range |
|---|---|---|
| New Construction | 0-5 years | 90-100 points |
| Recent Construction | 6-15 years | 80-89 points |
| Modern Construction | 16-30 years | 65-79 points |
| Middle-Aged | 31-50 years | 50-64 points |
| Older Property | 51-75 years | 35-49 points |
| Historic Property | 75+ years | 20-34 points |
Effective Age Adjustments
We incorporate renovations and updates to calculate an "effective age" that may differ from chronological age:
- Major Renovations: Can reduce effective age by up to 75% depending on scope and quality
- System Updates: Replacement of major systems (roof, HVAC, electrical, plumbing) can reduce effective age by 5-15 years each
- Cosmetic Updates: Minor improvements provide smaller adjustments to effective age
Building Code Era Considerations
Properties built during certain eras receive specific adjustments based on common building practices:
| Construction Era | Common Issues | Score Adjustment |
|---|---|---|
| Pre-1940s | Often have obsolete electrical systems | -10 points unless updated |
| 1940s-1960s | May have lead paint and asbestos concerns | -5 points unless remediated |
| 1970s-1980s | Often have dated mechanical systems | -3 points unless updated |
| 1990s-2000s | Generally built to modern codes | No adjustment |
| 2010s-Present | Incorporate energy efficiency and modern materials | +5 points |
More Detailed Factor Breakdowns Coming Soon
We're continuously enhancing our transparency with detailed explanations of our proprietary calculation methods.
Check back for detailed breakdowns of our Assessment Recency and Property Condition factors.
How to Use Our Risk Scores
For Homebuyers
- → Compare multiple properties on an objective scale
- → Identify potential issues before making an offer
- → Negotiate more effectively with sellers based on risk data
- → Budget appropriately for future maintenance and insurance
For Investors
- → Evaluate potential rental properties more effectively
- → Assess risk vs. return for investment opportunities
- → Monitor portfolio health over time
- → Identify properties that may need additional insurance
For Current Homeowners
- → Identify opportunities to improve property health
- → Prioritize maintenance and renovation projects
- → Prepare more effectively for natural disaster seasons
- → Track property health improvements over time
Continuous Improvement
Our property risk model is not static. We continuously refine and improve our methodology based on:
- New data sources as they become available
- Feedback from real estate professionals and users
- Emerging risk factors identified through ongoing research
- Updated statistical validation techniques
By integrating multiple risk dimensions into a single, easy-to-understand score, PropertyInsights 101 provides an invaluable tool for anyone making real estate decisions. Our commitment to data accuracy, algorithmic transparency, and continuous improvement ensures our risk assessment model remains at the cutting edge of property analysis.
Property Flags & Warning Indicators
In addition to the 8 core risk factors that determine the property health score, our system also identifies specific warning indicators or "flags" that highlight potential concerns without impacting the overall score.
Important Distinction
Unlike risk factors that contribute directly to the property health score calculation, property flags serve as supplementary warning indicators that highlight specific issues worthy of attention but do not affect the numeric health score.
Current Property Flags
Recent Flip Detection
Identifies properties that have been sold multiple times within a 12-month period, which may indicate a "flip" - a property purchased for rehabilitation and quick resale.
- High Severity: Sale within 3 months with >20% price increase
- Medium Severity: Sale within 6 months with >15% price increase
- Low Severity: Sale within 12 months with >10% price increase
While recent flips often represent valuable rehabilitation investments, they warrant additional scrutiny for workmanship quality and potential undisclosed issues.
Unpermitted Renovations
Detects properties with evidence of renovations but no matching building permits in public records.
Unpermitted work can lead to insurance claim denials, resale complications, and potential safety hazards if work wasn't performed to code.
Septic System Issues
Identifies properties with septic systems that lack proper permits or maintenance records.
- Missing Septic Permits: No installation or inspection permits found
- Maintenance Concerns: Older systems (>10 years) without recent maintenance records
Septic system failures can cost $10,000-$25,000 to remedy and may create environmental hazards.
Flood Risk Indicators
Identifies flood-related concerns beyond standard FEMA flood zone designations.
- Low Elevation: Properties less than 10 feet above nearest floodplain
- Map Revision in Progress: FEMA is actively revising flood maps in this area
- Recent Map Updates: Flood maps updated within the past 2 years
- LOMA Approval Rates: Low success rates for flood zone reclassification requests
These indicators help identify properties at potential flood risk even when not located in high-risk FEMA flood zones.
Air Quality Concerns
Identifies properties in areas with compromised air quality based on EPA standards.
- High Severity: Elevated lead or carbon monoxide levels
- Medium Severity: Elevated ozone, particulate matter, or overall pollution
- Critical Flag: Multiple severe air quality issues detected
Air quality issues can have significant health implications, particularly for sensitive individuals with respiratory conditions.
Natural Disaster Risk Indicators
Flags properties in areas with extreme natural disaster risk profiles based on historical data.
- Earthquake Risk: Areas with 2-3x national average seismic activity
- Hurricane Risk: Coastal regions with severe hurricane vulnerability
- Tornado Risk: Properties in high-frequency tornado zones
- Multiple Risks: Properties facing elevated risk from 2+ disaster types
Natural disaster flags highlight potential insurance complications and mitigation requirements that may affect ownership costs.
Crime Risk Alerts
Identifies properties in areas with crime rates significantly above national averages.
- High Crime Area: Overall crime rates >1.5x national average
- Violent Crime Risk: Violent crime rates significantly above average
- Specific Crime Indicators: Extreme rates of particular crime types
Crime risk affects insurance rates, property values, and may limit future buyer/renter pools. Provides specific remediation recommendations for security planning.
Not All Flags Appear on Every Property
Our system analyzes each property individually based on available data. Not every property will trigger all possible flags, and many properties may have no flags at all.